2.2 KiB
2.2 KiB
Line Segment Intersection Visualizer
An interactive geometric visualization tool that demonstrates rectangle area calculations and their relationship to a line segment.
Use Case
This tool provides a visual and interactive way to understand how moving a point affects the areas of rectangles formed with fixed anchor points. It's useful for:
- Educational purposes: Teaching geometric concepts like area calculation and coordinate systems
- Visual exploration: Understanding the relationship between point positions and resulting rectangle areas
- Interactive geometry: Exploring how rectangular areas change as a shared vertex moves along different paths
How It Works
The visualization displays:
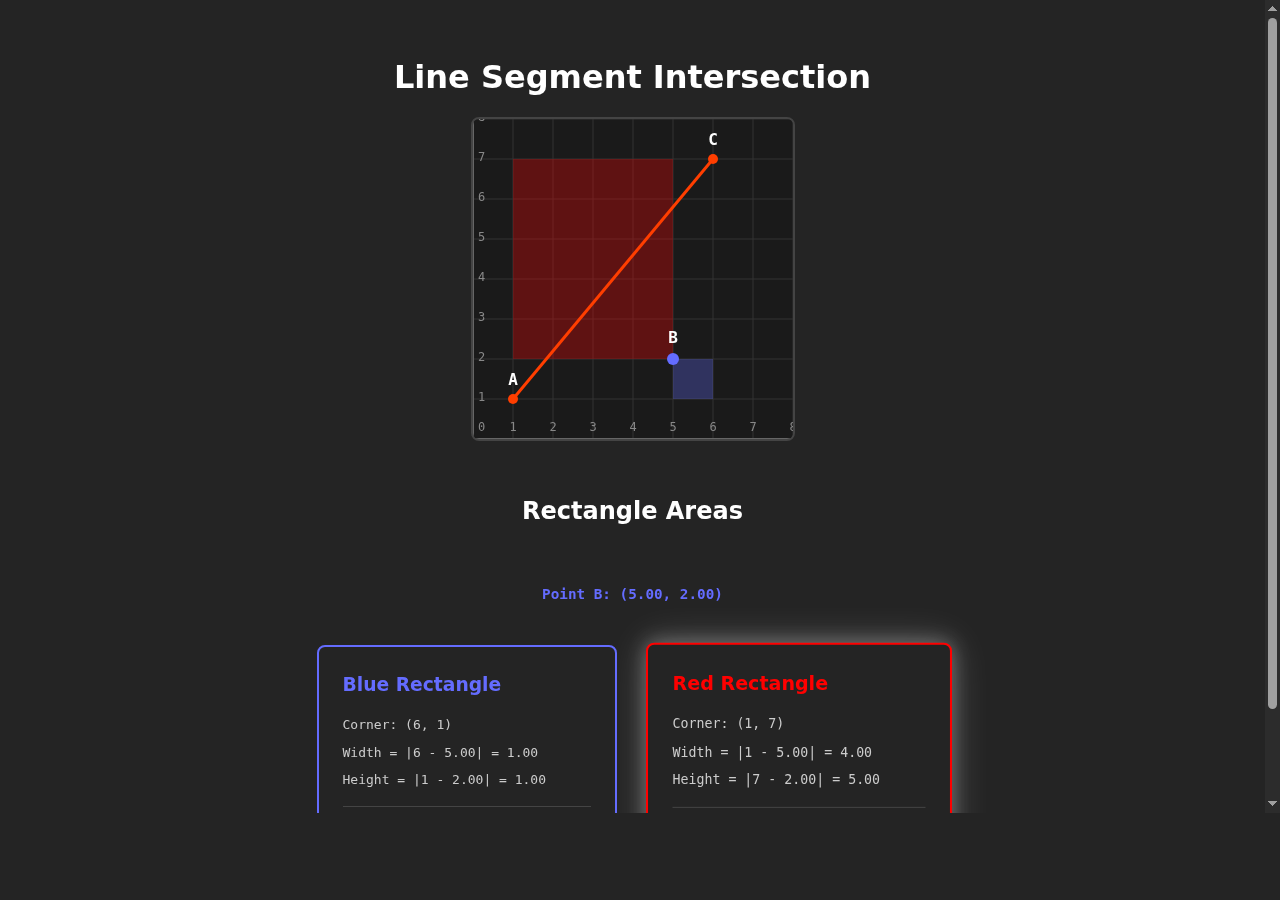
- Point A at (1, 1) - bottom-left anchor point
- Point C at (6, 7) - top-right anchor point
- Point B - movable point that follows your mouse cursor
- Line segment AC - connecting the two fixed points
- Blue rectangle - formed by point B and (cx, ay) = (6, 1)
- Red rectangle - formed by point B and (ax, cy) = (1, 7)
As you move your mouse over the canvas, point B follows the cursor, and the application:
- Calculates the width and height of both rectangles in real-time
- Computes and displays their areas with the calculation breakdown
- Highlights the larger rectangle with a glowing effect
Getting Started
Installation
npm install
Running the Application
npm run dev
Open your browser to the URL shown in the terminal (typically http://localhost:5173).
Building for Production
npm run build
npm run preview
Technical Stack
- Svelte 5 - Reactive UI framework
- Vite - Fast build tool and dev server
- HTML5 Canvas - 2D graphics rendering
Interface
The canvas displays an 8×8 grid where each cell is 40 pixels. Move your mouse over the grid to control point B and watch the rectangle areas update in real-time below the visualization.
The calculation cards show:
- Current position of point B
- Dimensions (width and height) of each rectangle
- Step-by-step area calculations
- The larger rectangle is highlighted with a glowing border